More and more companies are integrating the Kafka distributed event streaming platform into their information system. The reasons can be multiple, it can range from setting up event-oriented architectures, doing change data capture ( CDC ), or setting up a data-centric strategy (Kafka as a message bus). And as we all know, each new technology introduces challenges. The idea of this post is not to list the advantages and disadvantages of Kafka but rather to present the Strimzi project and how it responds to certain challenges that can be encountered.
Strimzi is an Open Source project and is integrated into an enterprise product called Red Hat AMQ Streams. It includes some very interesting features to simplify the process of running Apache Kafka in a Kubernetes cluster. It takes advantage of Operators to automate all operational tasks that are usually tedious and complicated to set up. It brings benefits in day 1 like deploying and running Kafka cluster and also in day 2 like cluster upgrade.
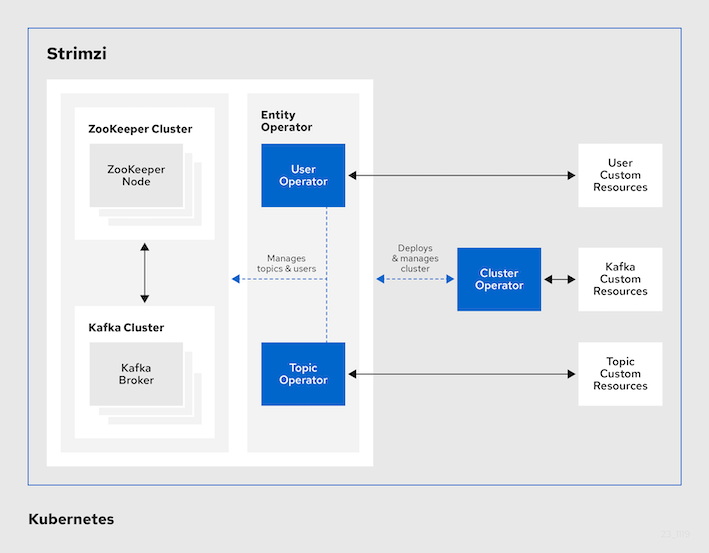
As I had the opportunity to recently work on this project, it is interesting that I share my progress with you. I used Strimzi on an OpenShift cluster, however the steps should be the same for a vanilla Kubernetes cluster.
To introduce the Strimzi features, I will simulate a production release of a Kafka cluster:
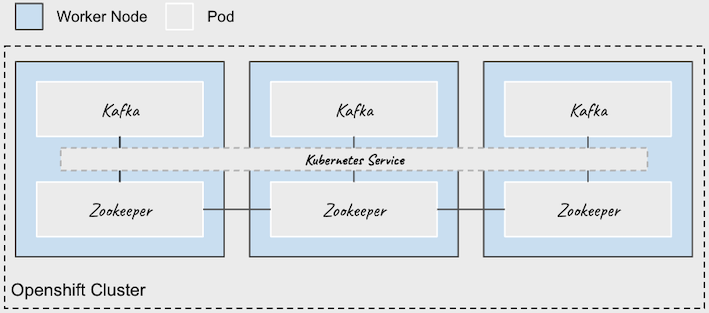
- A cluster of 3 highly available brokers
- Communication is always encrypted
- Access is restricted to authenticated and authorized users
- A complete monitoring solution for the Kafka platform
Deploy Strimzi Operator
Strimzi can be installed in three different ways - see Strimzi installation methods. I will use The OperatorHub method as it requires the least handling and allows to take advantage of automatic updates. I will also install the version just before the latest to be able to simulate a cluster upgrade later.
Note: the choice of the installation method will impact the update procedure that we will see at the end.
Once I checked the prerequisites and created a dedicated project called (kafka), the first step is to install Strimzi Operator Lifecycle Manager (OLM) :
git clone https://github.com/atiouajni/strimzi-kafka-demo && cd strimzi-kafka-demo
oc new-project kafka
oc create -f manifests/strimzi/strimzi-operator-group.yaml
oc create -f manifests/strimzi/strimzi-operator-subscription.yaml
NOTE : Only cluster administrators can install Operators to an OpenShift cluster.
We can verify that the installation is complete :
oc get events -w
LAST SEEN   TYPE      REASON                OBJECT                                                   MESSAGE
80m         Normal    Scheduled             pod/strimzi-cluster-operator-v0.27.0-6b56cbd7cc-b9gss    Successfully assigned kafka/strimzi-cluster-operator-v0.27.0-6b56cbd7cc-ntlf6 to master-1
...
0s          Normal    InstallSucceeded      clusterserviceversion/strimzi-cluster-operator.v0.27.0   install strategy completed with no errors
Strimzi will create necessary kubernetes resources like ClusterRole, RoleBinding and ServiceAccount and also will extend the Kubernetes API with CustomResourceDefinitions. Some of the created resources can be found in the Strimzi GitHub.
When deploying with the OperatorHub method, the operator deploys more resources than described in the previous link (e.g. ClusterRoles - kafkatopics.kafka.strimzi.io-v1beta2-admin).
Deploy Prometheus and Grafana Operators
To provide metrics information, Strimzi uses Prometheus and JMX Exporter Java agent. This feature helps us to monitor all the components (Kafka, Zookeeper, Strimzi operators…) easily using Prometheus to store the metrics and Grafana Dashboards to expose them. Strimzi provides docs and manifests to facilitate implementation.
oc create -f manifests/prometheus/prometheus-operator-subscription.yaml
oc create -f manifests/grafana/grafana-operator-subscription.yaml
Create a secure Kafka cluster
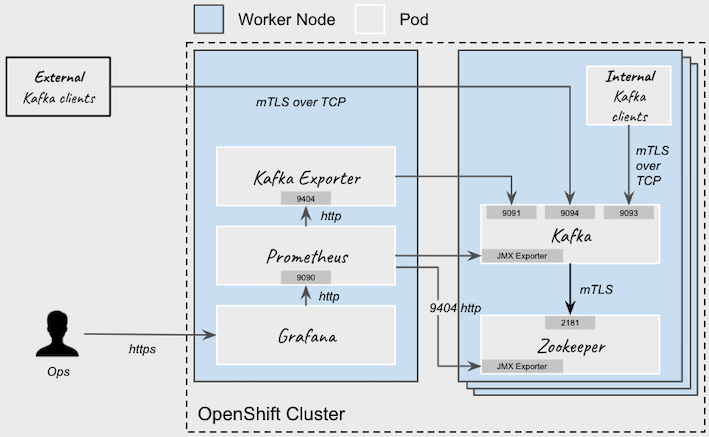
Strimzi makes the broker setup part a lot easier. Through a single kind: Kafka manifest, we are able to deploy multiple Zookeeper and Kafka instances. Cluster Operator automatically sets up TLS certificates for data encryption and authentication within the cluster. It only remains to say that we want to expose an internal and external kafka listener with TLS encryption and enable authentication and Kafka simple authorization. External clients can access the Kafka through an OpenShift Route.
NOTE : If you do not have access to the Quay.io Registry (Disconnected platform) or want to use your own container repository, you can push container images to your own registry by following this guide.
oc create -f manifests/strimzi/kafka-cluster.yml
Here is an image to illustrate my configuration :
We can verify that the deployment is done without issue, it should take a few minutes :
oc get events -w
LAST SEEN   TYPE      REASON                  OBJECT                                                      MESSAGE
11s         Normal    Provisioning            persistentvolumeclaim/data-my-cluster-zookeeper-0           External provisioner is provisioning volume for claim "kafka/data-my-cluster-zookeeper-0"
...
8s          Normal    SuccessfulCreate        statefulset/my-cluster-zookeeper                            create Pod my-cluster-zookeeper-0 in StatefulSet my-cluster-zookeeper successful
8s          Normal    SuccessfulCreate        statefulset/my-cluster-zookeeper                            create Pod my-cluster-zookeeper-1 in StatefulSet my-cluster-zookeeper successful
8s          Normal    SuccessfulCreate        statefulset/my-cluster-zookeeper                            create Pod my-cluster-zookeeper-2 in StatefulSet my-cluster-zookeeper successful
...
0s          Normal    SuccessfulCreate        statefulset/my-cluster-kafka                                create Pod my-cluster-kafka-0 in StatefulSet my-cluster-kafka successful
0s          Normal    SuccessfulCreate        statefulset/my-cluster-kafka                                create Pod my-cluster-kafka-1 in StatefulSet my-cluster-kafka successful
0s          Normal    SuccessfulCreate        statefulset/my-cluster-kafka                                create Pod my-cluster-kafka-2 in StatefulSet my-cluster-kafka successful
...
oc get pods -w
NAME                                                   READY   STATUS    RESTARTS   AGE
grafana-operator-controller-manager-6f456b8f58-vvqd8   2/2     Running   0          2m
my-cluster-entity-operator-6766d76694-fwv2j            3/3     Running   0          82s
my-cluster-kafka-0                                     1/1     Running   0          82s
my-cluster-kafka-1                                     1/1     Running   0          82s
my-cluster-kafka-2                                     1/1     Running   0          82s
my-cluster-kafka-exporter-57f58dd7fc-lh2jb             1/1     Running   0          82s
my-cluster-zookeeper-0                                 1/1     Running   0          82s
my-cluster-zookeeper-1                                 1/1     Running   0          82s
my-cluster-zookeeper-2                                 1/1     Running   0          82s
prometheus-operator-5b9b44b48f-jngfx                   1/1     Running   0          2m
strimzi-cluster-operator-v0.27.0-6b56cbd7cc-ntlf6      1/1     Running   0          82s
By default, Strimzi automatically creates a NetworkPolicy resource for every listener that is enabled on a Kafka broker. This NetworkPolicy allows applications to connect to listeners in all namespaces.
oc get networkpolicy
NAME                                  POD-SELECTOR                           AGE
my-cluster-network-policy-kafka       strimzi.io/name=my-cluster-kafka       1h
my-cluster-network-policy-zookeeper   strimzi.io/name=my-cluster-zookeeper   1h
oc describe networkpolicy my-cluster-network-policy-kafka
Name:         my-cluster-network-policy-kafka
...
Spec:
  PodSelector:     strimzi.io/name=my-cluster-kafka
  Allowing ingress traffic:
    To Port: 9090/TCP
    From:
      PodSelector: strimzi.io/name=my-cluster-kafka
    ----------
    To Port: 9091/TCP
    From:
      PodSelector: strimzi.io/kind=cluster-operator
    From:
      PodSelector: strimzi.io/name=my-cluster-kafka
    From:
      PodSelector: strimzi.io/name=my-cluster-entity-operator
    From:
      PodSelector: strimzi.io/name=my-cluster-kafka-exporter
    From:
      PodSelector: strimzi.io/name=my-cluster-cruise-control
    ----------
    To Port: 9093/TCP
    From: <any> (traffic not restricted by source)
    ----------
    To Port: 9094/TCP
    From: <any> (traffic not restricted by source)
    ----------
    To Port: 9404/TCP
    From: <any> (traffic not restricted by source)
  Not affecting egress traffic
  Policy Types: Ingress
My configuration does not show all Strimzi capabilities. One of the interesting features is that it allows brokers to be distributed over several availability zones, data centers or in several machine room to maintain resilience. This can be done through the rack awareness and pod affinity features.
Even though I used Mutual TLS and simple authz, Strimzi supports more authentication and authorization mechanisms:
| Authentication | Authorization |
|---|---|
| Mutual TLS client authentication | Simple authorization |
| SASL SCRAM-SHA-512 | OAuth 2.0 authorization (Keycloak only) |
| OAuth 2.0 token based authentication | Open Policy Agent (OPA) authorization |
| Custom authentication | Custom authorization |
Deploy Metrics Platform
Prometheus and Grafana Operator help us to deploy local Prometheus, Alertmanager and Grafana instances where we could visualize and monitor Apache Kafka cluster metrics.
I’m using yq command to edit files before creating resources. If you don’t have it, you can edit the manifest manually.
You can skip yq commands if you deploy on a namespace called kafka.
yq -i '.spec.namespaceSelector.matchNames=["<project-name>"]' manifests/prometheus/PodMonitor-strimzi.yaml
yq -i '.subjects[].namespace="<project-name>"' manifests/prometheus/Prometheus-instance.yaml
yq -i '.spec.alerting.alertmanagers[].namespace="<project-name>"' manifests/prometheus/Prometheus-instance.yaml

oc create -f manifests/grafana/Grafana-instance.yaml
oc create -f manifests/prometheus/Prometheus-instance.yaml
oc create -f manifests/prometheus/Alertmanager-instance.yaml
We check that everything starts correctly:
oc get pods
NAME                                                   READY   STATUS    RESTARTS   AGE
grafana-deployment-76548b566d-9ldqs                    1/1     Running   0          1m
prometheus-prometheus-0                                2/2     Running   0          1m
alertmanager-alertmanager-0                            2/2     Running   0          1m
...
We specify Prometheus to monitor the pods and collect the specified metric endpoints:
oc create -f manifests/prometheus/PodMonitor-strimzi.yaml
oc create -f manifests/prometheus/PrometheusRule-alert-rules.yaml
And to finish, we import Grafana datasource and dashboards:
oc create -f manifests/grafana/GrafanaDataSource-prometheus.yaml \
-f manifests/grafana/GrafanaDashboard-strimzi-kafka.yaml \
-f manifests/grafana/GrafanaDashboard-strimzi-zookeeper.yaml \
-f manifests/grafana/GrafanaDashboard-strimzi-kafka-exporter.yaml \
-f manifests/grafana/GrafanaDashboard-strimzi-operators.yaml
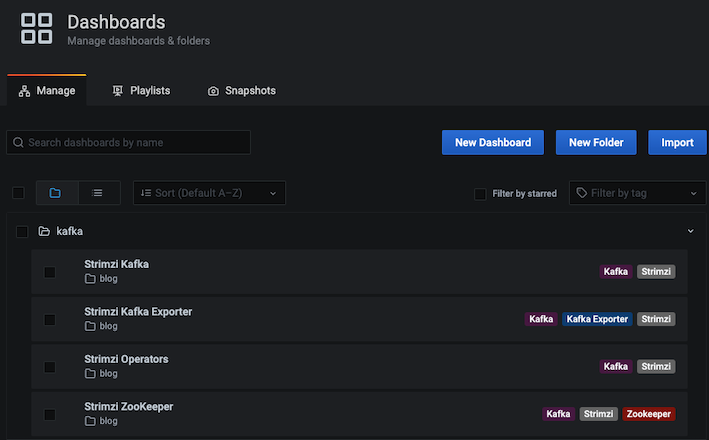
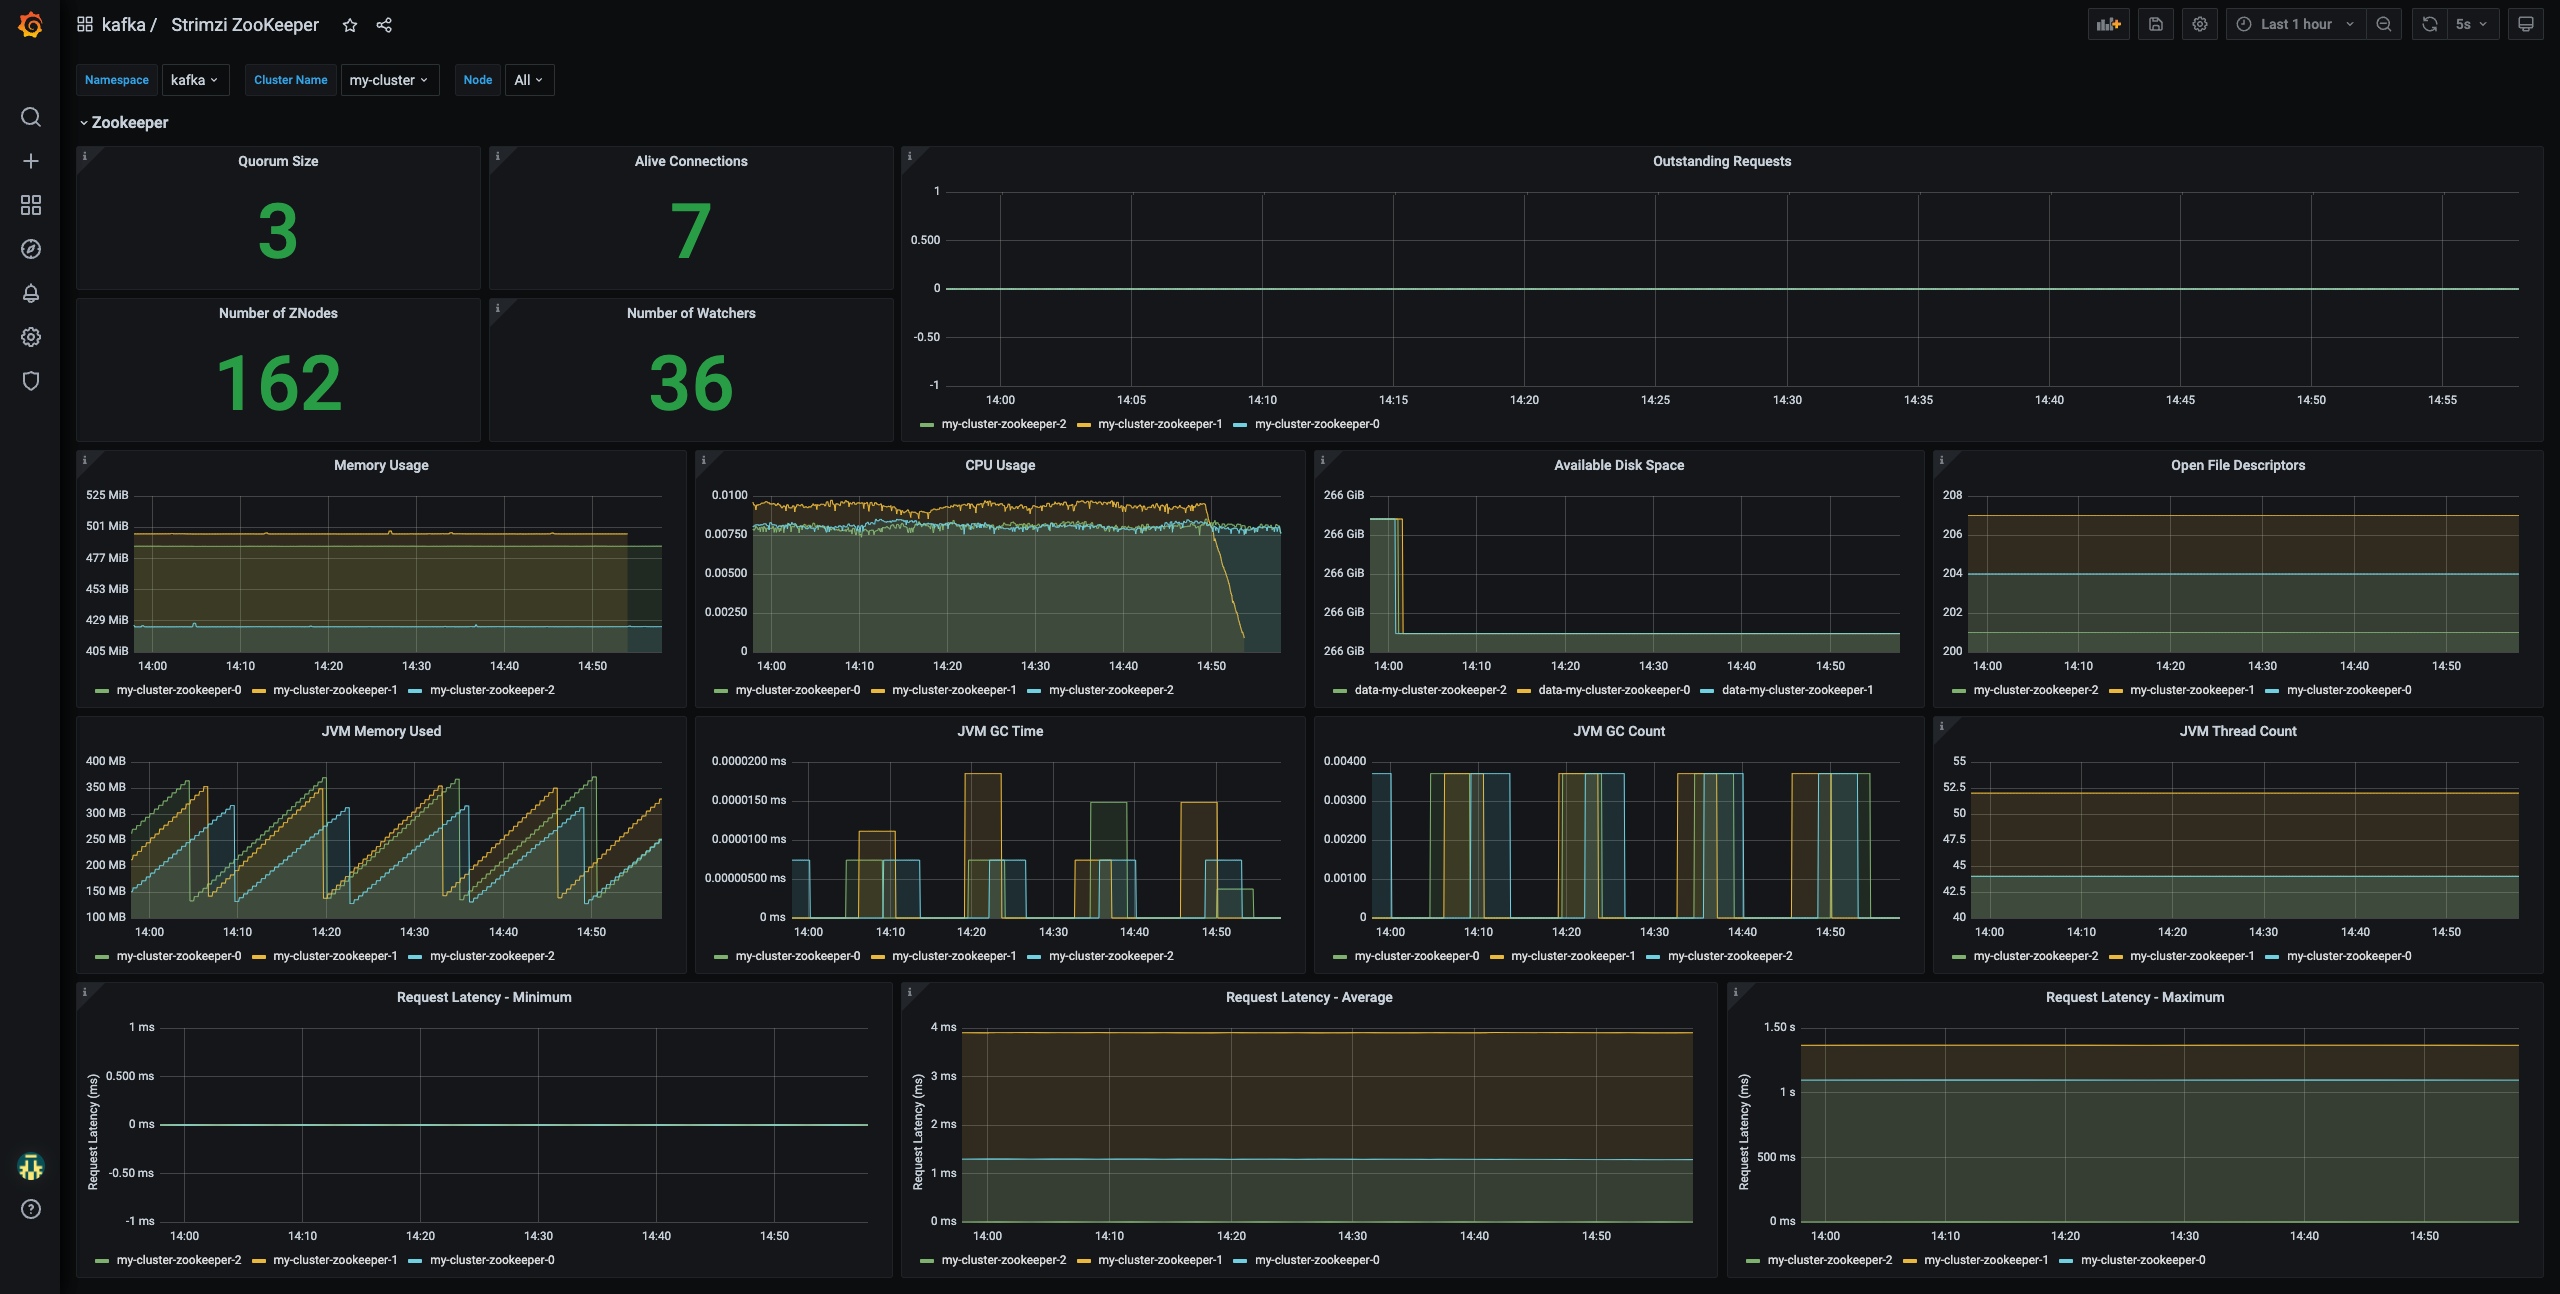
We can now visualize our new dashboards by retrieving the Route to access to Grafana :
oc get route grafana-route -o jsonpath='{.spec.host}'
From a web browser, the list of dashboards is accessible at the url <hostname>/dashboards
| Kafka dashboard | Zookeeper dashboard |
|---|---|
 |
 |
Upgrading Kafka
Upgrading the Kafka cluster will depend on the method that was used to install Strimzi. In my case, I start by checking the prerequisites and updating my OLM to the latest version.
I check that a new version of Strimzi OLM exists :
oc get packagemanifest/strimzi-kafka-operator -o=jsonpath='{.status.channels[*].name}'
stable strimzi-0.19.x strimzi-0.20.x strimzi-0.21.x strimzi-0.22.x strimzi-0.23.x strimzi-0.24.x strimzi-0.25.x strimzi-0.26.x strimzi-0.27.x strimzi-0.28.x
Then, I check the version of my installed operator and Kafka cluster:
oc get csv -o=jsonpath='{.items[?(@.spec.provider.name=="Strimzi")].spec.version}'
0.27.1
oc get Kafka -o=jsonpath='{.items[0].spec.kafka.version}'
3.0.0
As I want to install the latest version of my OLM, I check the version compatibility between the operator and the Kafka cluster. (Strimzi Supported Versions)
| Operators | Kafka versions | Kubernetes versions |
|---|---|---|
| 0.28.0 | 3.0.0, 3.1.0 | 1.16+ |
| 0.27.1 | 2.8.0, 2.8.1, 3.0.0 | 1.16+ |
The above table tells us that the latest version of the Strimzi operator can also handle Kafka version 3.0.0 without needing to update the Kafka instances. However, I will take the opportunity to upgrade my cluster to 3.1.0.
I patch the Subscription to move to the desired update channel: strimzi-0.28.x
oc get subscription
NAME                     PACKAGE                  SOURCE                CHANNEL
grafana-operator         grafana-operator         community-operators   v4
prometheus               prometheus               community-operators   beta
strimzi-kafka-operator   strimzi-kafka-operator   community-operators   strimzi-0.27.x
oc patch subscription/strimzi-kafka-operator --patch '{"spec":{"channel":"strimzi-0.28.x"}}' --type=merge
subscription.operators.coreos.com/strimzi-kafka-operator patched
Patching the subscription to the latest version will trigger rolling updates, where all brokers are restarted in turn, at different stages of the process. During rolling updates, not all brokers are online, so overall cluster availability is temporarily reduced.
oc get events -w
LAST SEEN   TYPE      REASON      OBJECT                                           MESSAGE
<invalid>   Warning   Unhealthy   pod/my-cluster-kafka-exporter-645b8bbb48-9pbv2   Readiness probe failed: Get "http://10.129.2.120:9404/metrics": context deadline exceeded (Client.Timeout exceeded while awaiting headers)
<invalid>   Warning   BackOff     pod/my-cluster-kafka-exporter-645b8bbb48-9pbv2   Back-off restarting failed container
84s         Normal    Success     grafanadashboard/strimzi-kafka-dashboard         dashboard kafka/strimzi-kafka-dashboard successfully submitted
0s          Normal    RequirementsUnknown   clusterserviceversion/strimzi-cluster-operator.v0.28.0   requirements not yet checked
0s          Normal    BeingReplaced         clusterserviceversion/strimzi-cluster-operator.v0.27.1   being replaced by csv: strimzi-cluster-operator.v0.28.0
...
0s          Normal    SuccessfulCreate      replicaset/strimzi-cluster-operator-v0.28.0-6b56cbd7cc   Created pod: strimzi-cluster-operator-v0.28.0-6b56cbd7cc-8txbm
0s          Normal    Scheduled             pod/strimzi-cluster-operator-v0.28.0-6b56cbd7cc-8txbm    Successfully assigned kafka/strimzi-cluster-operator-v0.28.0-6b56cbd7cc-8txbm to master-0
...
0s          Normal    Created               pod/strimzi-cluster-operator-v0.28.0-6b56cbd7cc-8txbm    Created container strimzi-cluster-operator
0s          Normal    Started               pod/strimzi-cluster-operator-v0.28.0-6b56cbd7cc-8txbm    Started container strimzi-cluster-operator
<invalid>   Normal    Killing               pod/my-cluster-zookeeper-0                               Stopping container zookeeper
0s          Normal    Replaced              clusterserviceversion/strimzi-cluster-operator.v0.27.1   has been replaced by a newer ClusterServiceVersion that has successfully installed.
<invalid>   Normal    Killing               pod/strimzi-cluster-operator-v0.27.1-7c54fd4fbb-qncvc    Stopping container strimzi-cluster-operator
...
0s          Normal    SuccessfulCreate      statefulset/my-cluster-zookeeper                         create Pod my-cluster-zookeeper-0 in StatefulSet my-cluster-zookeeper successful
0s          Normal    Scheduled             pod/my-cluster-zookeeper-0                               Successfully assigned kafka/my-cluster-zookeeper-0 to compute-2
...
<invalid>   Normal    Created               pod/my-cluster-zookeeper-0                               Created container zookeeper
<invalid>   Normal    Started               pod/my-cluster-zookeeper-0                               Started container zookeeper
0s          Normal    Killing               pod/my-cluster-zookeeper-2                               Stopping container zookeeper
0s          Normal    SuccessfulCreate      statefulset/my-cluster-zookeeper                         create Pod my-cluster-zookeeper-2 in StatefulSet my-cluster-zookeeper successful
0s          Normal    Scheduled             pod/my-cluster-zookeeper-2                               Successfully assigned kafka/my-cluster-zookeeper-2 to master-2
...
0s          Normal    SuccessfulCreate      statefulset/my-cluster-zookeeper                         create Pod my-cluster-zookeeper-1 in StatefulSet my-cluster-zookeeper successful
0s          Normal    Scheduled             pod/my-cluster-zookeeper-1                               Successfully assigned kafka/my-cluster-zookeeper-1 to compute-0
...
<invalid>   Normal    Created                  pod/my-cluster-kafka-0                                   Created container kafka
<invalid>   Normal    Started                  pod/my-cluster-kafka-0                                   Started container kafka
0s          Normal    Killing                  pod/my-cluster-kafka-2                                   Stopping container kafka
...
0s          Normal    SuccessfulCreate         statefulset/my-cluster-kafka                             create Pod my-cluster-kafka-2 in StatefulSet my-cluster-kafka successful
0s          Normal    Scheduled                pod/my-cluster-kafka-2                                   Successfully assigned kafka/my-cluster-kafka-2 to master-2
...
0s          Normal    ScalingReplicaSet        deployment/my-cluster-kafka-exporter                     Scaled up replica set my-cluster-kafka-exporter-57f58dd7fc to 1
0s          Normal    SuccessfulCreate         replicaset/my-cluster-kafka-exporter-57f58dd7fc          Created pod: my-cluster-kafka-exporter-57f58dd7fc-c2hbq
0s          Normal    Scheduled                pod/my-cluster-kafka-exporter-57f58dd7fc-c2hbq           Successfully assigned kafka/my-cluster-kafka-exporter-57f58dd7fc-c2hbq to compute-2
...
<invalid>   Normal    Created                  pod/my-cluster-kafka-exporter-57f58dd7fc-c2hbq           Created container my-cluster-kafka-exporter
<invalid>   Normal    Started                  pod/my-cluster-kafka-exporter-57f58dd7fc-c2hbq           Started container my-cluster-kafka-exporter
0s          Normal    ScalingReplicaSet        deployment/my-cluster-kafka-exporter                     Scaled down replica set my-cluster-kafka-exporter-645b8bbb48 to 0
0s          Normal    SuccessfulDelete         replicaset/my-cluster-kafka-exporter-645b8bbb48          Deleted pod: my-cluster-kafka-exporter-645b8bbb48-9pbv2
If topics are configured for high availability, upgrading Strimzi should not cause any downtime for consumers and producers that publish and read data from those topics. Highly available topics have a replication factor of at least 3 and partitions distributed evenly among the brokers.
After I have upgraded the Cluster Operator to 0.28.0, the next step is to upgrade all Kafka brokers to the latest supported version of Kafka.
yq -i '.spec.kafka.version="3.1.0"' manifests/strimzi/kafka-cluster.yml
oc replace -f manifests/strimzi/kafka-cluster.yml
After patching the Kafka resource, the Cluster Operator will initiate rolling updates for the Kafka cluster. Once the upgrade is complete, we can check that Kafka is running with the new version :
oc logs pods/my-cluster-kafka-0 | grep "Kafka version"
2022-03-07 19:24:44,934 INFO Kafka version: 3.1.0 (org.apache.kafka.common.utils.AppInfoParser) [main]
Now that the cluster is using the new version, client applications need to be upgraded. There are 2 strategies but since that is not the focus of my post, I may describe this step later.
I continue with the cluster upgrade :
yq -i '.spec.kafka.config."inter.broker.protocol.version"="3.1"' manifests/strimzi/kafka-cluster.yml
yq -i '.spec.kafka.config."log.message.format.version"="3.1"' manifests/strimzi/kafka-cluster.yml
oc replace -f manifests/strimzi/kafka-cluster.yml
Note : From Kafka 3.0.0, when the
inter.broker.protocol.versionis set to 3.0 or higher, thelog.message.format.versionproperty is ignored and doesn’t need to be set.
The Cluster Operator will initiate a third rolling updates for the Kafka cluster.
In summary, here is the procedure I followed:
- Check prerequisites
- Upgrade OLM
- Upgrade Kafka Brokers version
- Upgrade all the consuming applications.
- Upgrade Kafka Brokers inter.broker.protocol version
- Upgrade all the producing applications.
The full upgrade process is very well documented by Strimzi. And thanks to the improvements, the upgrade becomes more easy.
Encountered issues
When I deployed my Grafana Dashboard for the first time, I didn’t get any metrics from Prometheus. Every Grafana panel was empty or N/A.
I noticed that when Grafana made a request to Prometheus, it returned an empty response https://<server-hostname>/api/datasources/proxy/1/api/v1/query?query=XXX
So I made the Prometheus url accessible via a Route and I checked that the metrics were indeed collected by Prometheus.
oc create -f manifests/prometheus/prometheus-route.yaml
As soon as I accessed the UI, I saw this message in Prometheus UI :
Warning: Error fetching server time: Detected ***** seconds time difference between your browser and the server. Prometheus relies on accurate time and time drift might cause unexpected query results.

And indeed, my Openshift server was not at the right time. I updated the time on my OCP nodes and everything started working !
date +%T -s "10:13:13"
Summary
We are able to deploy a Kafka cluster easily without the configuration complexity that we can have during traditional installation. Strimzi provides an abstraction layer to simplify operational tasks. Deploying, upgrading and monitoring become tasks much more mastered and easy to achieve.