Keycloak is a powerful identity and authentication server widely used to secure web applications and API services. However, one of the limitations of Keycloak is the lack of built-in observability metrics, such as the number of authentications performed within a realm. This can make it challenging to track and monitor Keycloak’s usage and performance in a production environment.
Fortunately, Keycloak provides an extensible architecture through Service Provider Interfaces (SPIs), which allow you to extend the basic functionalities of Keycloak to meet specific needs. In the case of observability metrics, there is an open-source SPI available that interfaces with Prometheus, a popular monitoring and metrics management system. This SPI enables the collection and exposure of Keycloak-related metrics, which can then be visualized in a graphical interface like Grafana.

In this post, we will explore how to use this SPI to add observability metrics to Keycloak and display them in Grafana. We will use Podman to deploy each application in a separate container :
- Keycloak (21.0.2)
- Prometheus (2.44.0)
- Grafana (9.5.2)
- Keycloak Metrics SPI (3.0.0)
You will find all the files in my GitHub repository
Create a new Keycloak image with the SPI
- Visit the Keycloak Prometheus SPI GitHub repository here
- Download the JAR file corresponding to the latest stable version of the SPI (current versions is 3.0.0)
To install an SPI in Keycloak, we must place the JAR file in /opt/keycloak/providers/ directory. And since we are using containers for this post, we will create a new Keycloak image and copy the SPI into this directory.
git clone http://github.com/atiouajni/keycloak-observability
cd keycloak-observability

podman build -t keycloak-observability -f Containerfile
Deploy the podman typology
- Deploy Keycloak, Prometheus and Grafana:
Open a terminal and run the following commands:
podman create network net1
podman pod create -p 8181:8080 --network net1 keycloak-pod
podman pod create -p 9191:9090 --network net1 prometheus-pod
podman pod create -p 3131:3000 --network net1 grafana-pod

podman run --name keycloak -d --pod keycloak-pod -e KEYCLOAK_ADMIN=admin -e KEYCLOAK_ADMIN_PASSWORD=admin localhost/keycloak-observability start-dev --metrics-enabled=true
podman run --name prometheus -d --pod prometheus-pod -v $(pwd)/prometheus-config.yaml:/etc/prometheus/prometheus.yml quay.io/prometheus/prometheus:v2.44.0
podman run --name grafana -d --pod grafana-pod grafana/grafana:9.5.2
This configuration will give us the below typology :

You can run the following commands to check the logs of Keycloak container and verify that the SPI has started successfully:
podman logs keycloak
You should see these lines :
2023-05-27 00:30:07,484 WARN  [org.keycloak.services] (build-13) KC-SERVICES0047: metrics (org.jboss.aerogear.keycloak.metrics.MetricsEndpointFactory) is implementing the internal SPI realm-restapi-extension. This SPI is internal and may change without notice

2023-05-27 00:30:11,186 WARN  [org.keycloak.services] (build-13) KC-SERVICES0047: metrics-listener (org.jboss.aerogear.keycloak.metrics.MetricsEventListenerFactory) is implementing the internal SPI eventsListener. This SPI is internal and may change without notice
-
Check Prometheus status
- Open a browser and access the URL
http://localhost:9191to access the Prometheus interface. - Select ‘Status’ > ‘Targets’ and check the endpoint
http://keycloak-pod:8080/realms/master/metricsisUP.
- Open a browser and access the URL

Configure Keycloak - Enable metrics-listener event
To enable the event listener via the GUI interface, go to Manage -> Events -> Config. The Event Listeners configuration should have an entry named metrics-listener.
To enable the event listener via the Keycloak CLI :
podman exec -it keycloak /bin/bash
cd /opt/keycloak/bin
./kcadm.sh config credentials --server http://localhost:8080 --realm master --user $KEYCLOAK_ADMIN --password $KEYCLOAK_ADMIN_PASSWORD
./kcadm.sh update events/config -s "eventsEnabled=true" -s "adminEventsEnabled=true" -s "eventsListeners+=metrics-listener"
Access Keycloak observability through Grafana dashboard
- Open a browser and access the URL
http://localhost:3131to access the Grafana interface. - Log in with the default credentials (admin/admin).
- Click on the menu icon (represented by three horizontal lines) located at the top-left corner and select
Connections. Then, create a Prometheus Connections and set the url tohttp://prometheus-pod:9090. - From the menu, click now on “Dashboards” and select “New -> Import”
- Import the dashboard file
grafana-dashboard-legacy.jsonand set Prometheus instance as a datasource.
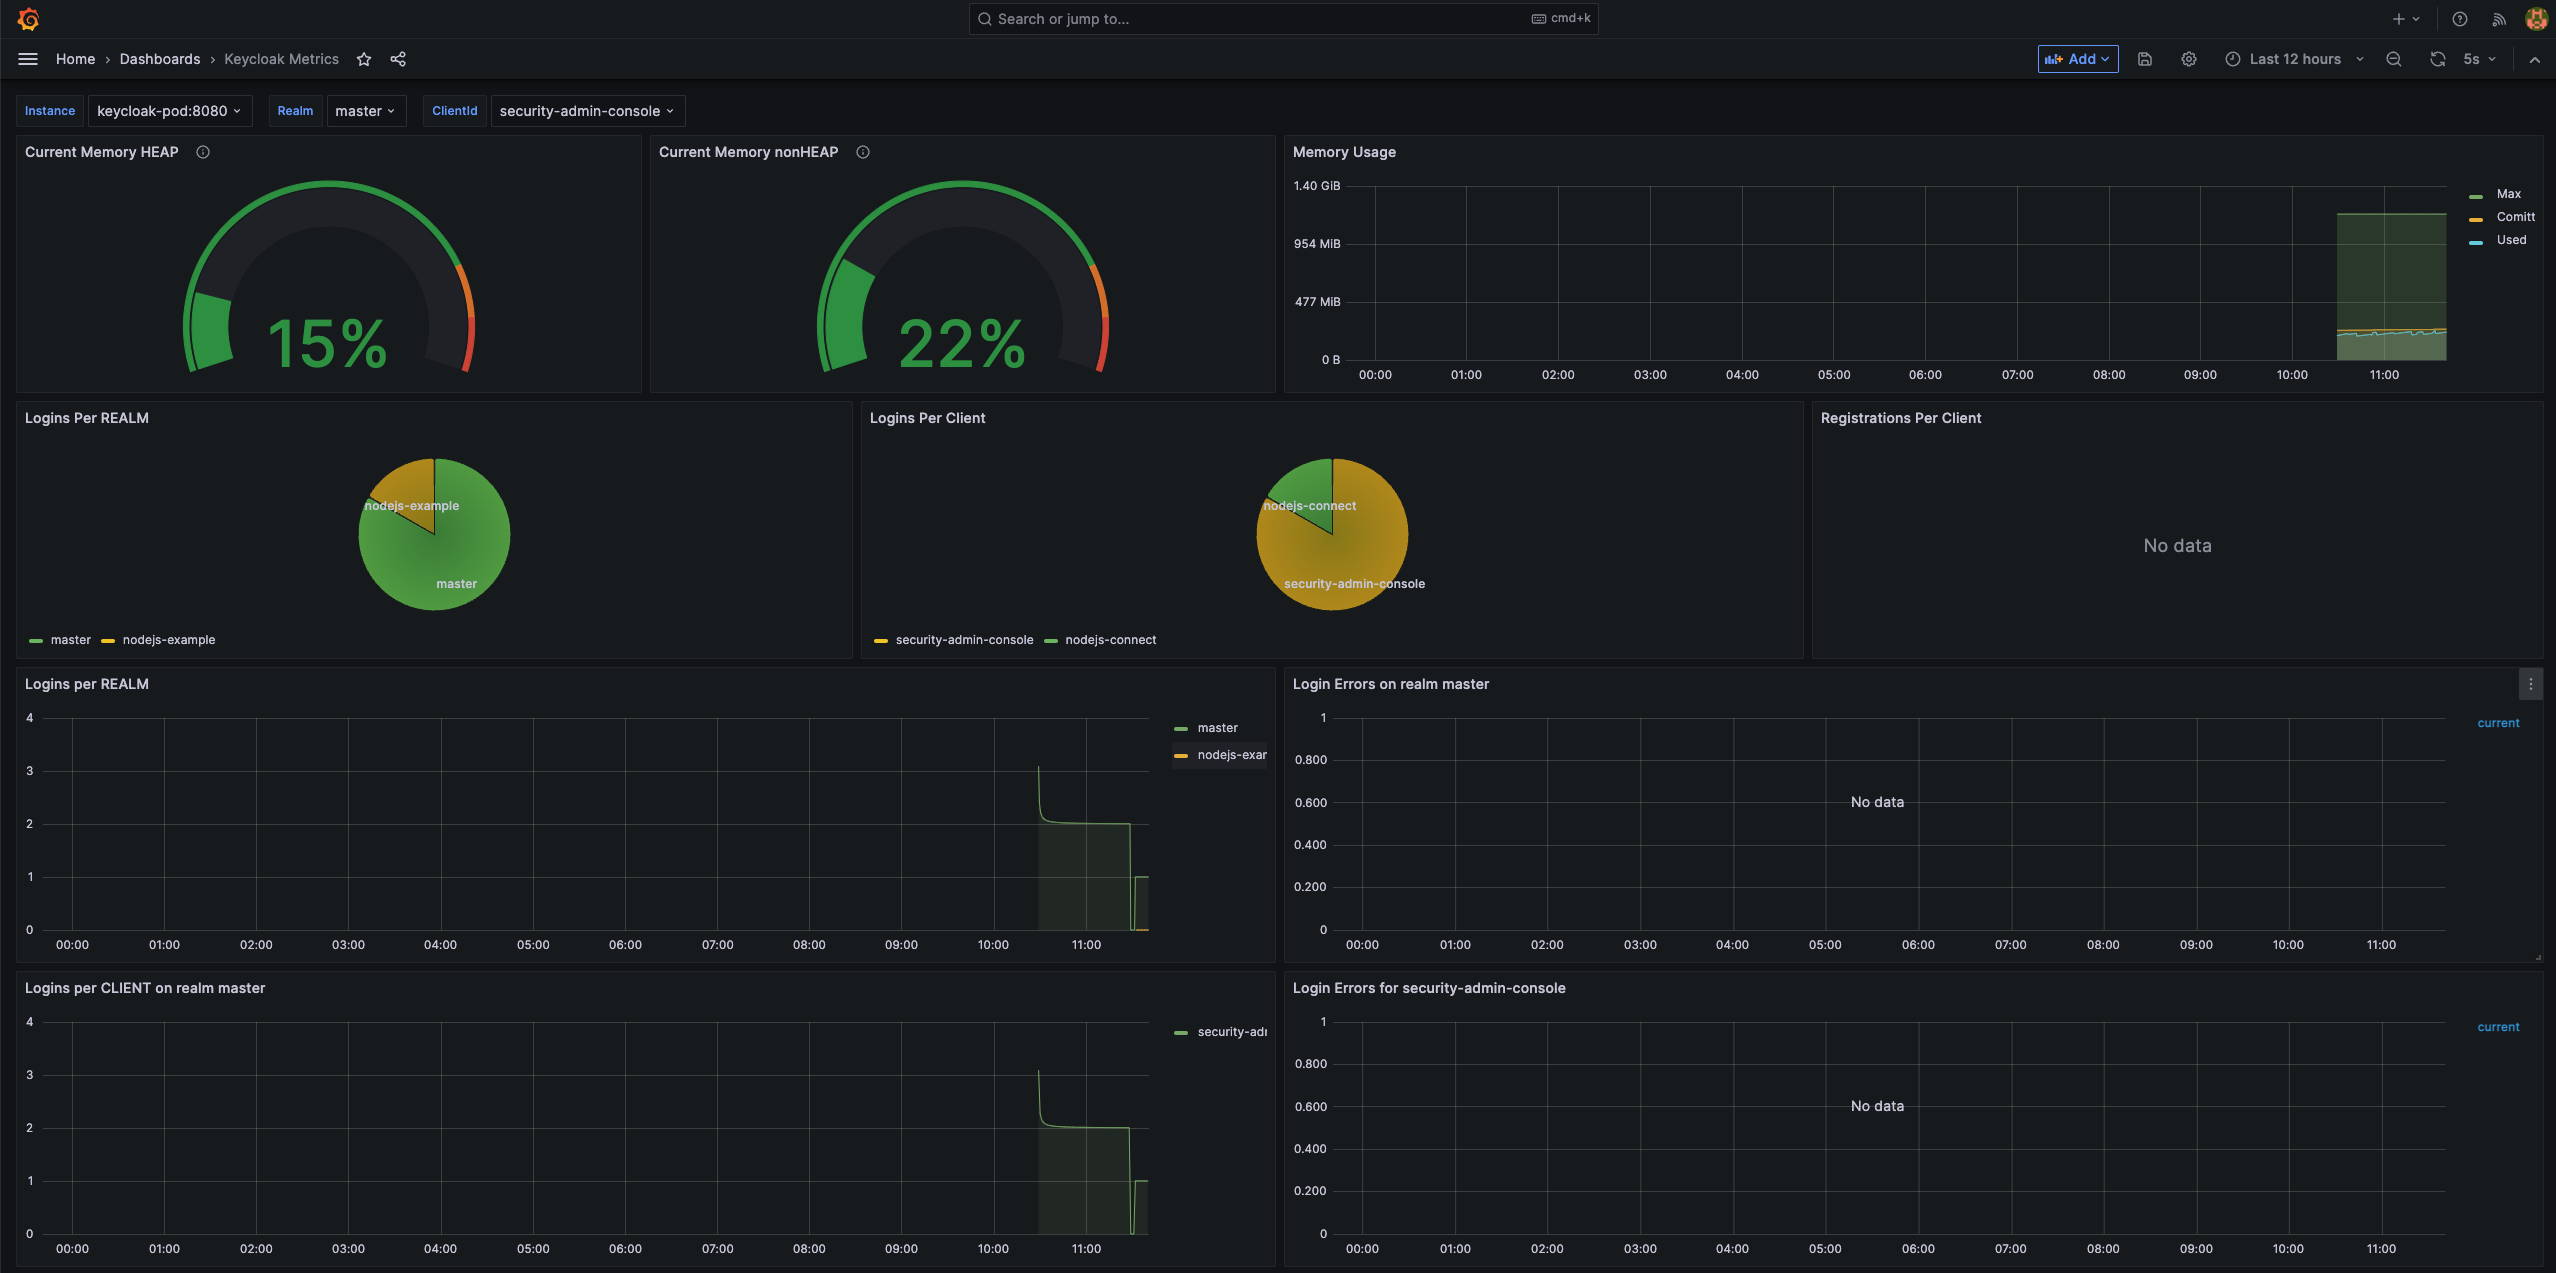
Now you can monitor metrics from your keycloak realms like :
- Total number of login attempts
- Total failed login attempts
- Total successful client logins
- Total registered users
- Total errors on registrations
- and many others…
Conclusion
By utilizing Keycloak Metrics SPI, it is possible to extend Keycloak’s capabilities by adding observability metrics. Integrating Keycloak with Prometheus and Grafana enables you to monitor and visualize Keycloak’s authentication and usage metrics in a production environment. This allows you to closely track Keycloak’s activity, diagnose potential issues, and make informed decisions to improve its performance and reliability.
Encountered issues
- For macOS users, leaving the podman VM running will cause a time drift pretty quickly. Prometheus relies on accurate time and time drift might cause unexpected query results. Restarting the VM solve the issue.
- The SPI keycloak metric seems to be not compatible with Keycloak latest version (21.0.2)